A windrose is a graph showing the direction and speed wind is traveling. The windrose shown above depicts the wind behavior in a region of Maine. Wind speed and direction are geographic variables so this can be considered geovisualization or a map.
A star plot is a way of viewing data that contains many variables, all of which link together to form the "star" appearance. The image above shows the amount of elements that together make up a particular basin. As this is a geographic variable, this can be considered geovisualization or a map.
A stem and leaf plot graphs quantities by putting the "stem", or beginning number on the left side of the line then the "leaves" or last numbers on the right side. The graph above shows the infant mortality rates in the West Africa region. Because mortality rates can be considered geographic variables, this constitutes as a geovisualization or map.
A population profile displays the properties of a particular population by dividing them by age and gender. In the image above, a view of indigenous and non-indiginous peoples of Australia are being compared. Population is a geographic variable so this can be considered geovisualization or a map.
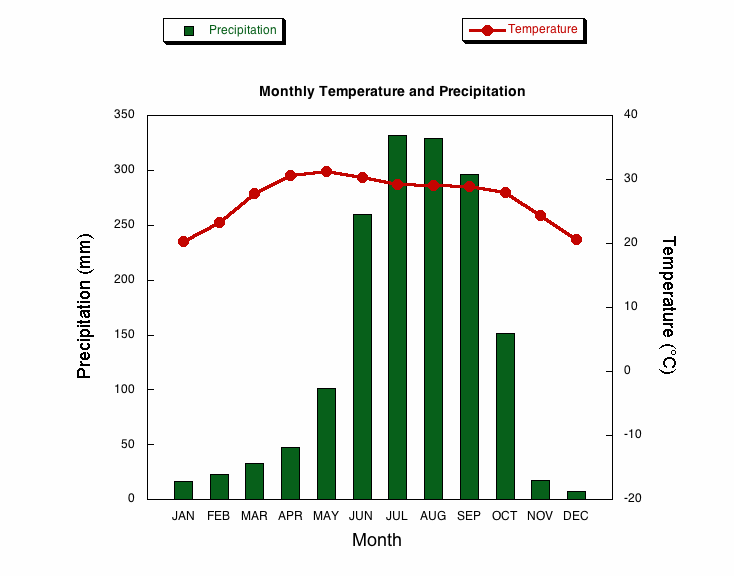
A climograph is a graph depicting climate variables. The image above shows monthly precipitation and temperature in a particular region. Climate is a geographic variable, which makes this a map or geovisualization.
A histogram is a graph that shows the distribution of data. When the variable in question is geographic, the histogram can be considered geovisualiztion or a map. The image above is a histogram constructed from the US census to determine a history of travel time. Since the population is a geographic variable, this is considered geovisualization.
A boxplot is a very precise way to view quantities in a sample set of interest. It shows the range, percentiles, and mean of the set. When the variables are geographic, it can be considered geovisualiztion or a map. The image above shows results from water test from a particular water source. As this is a geographic variable, it can be considered geovisualization.


