Map Catalog
Saturday, July 20, 2013
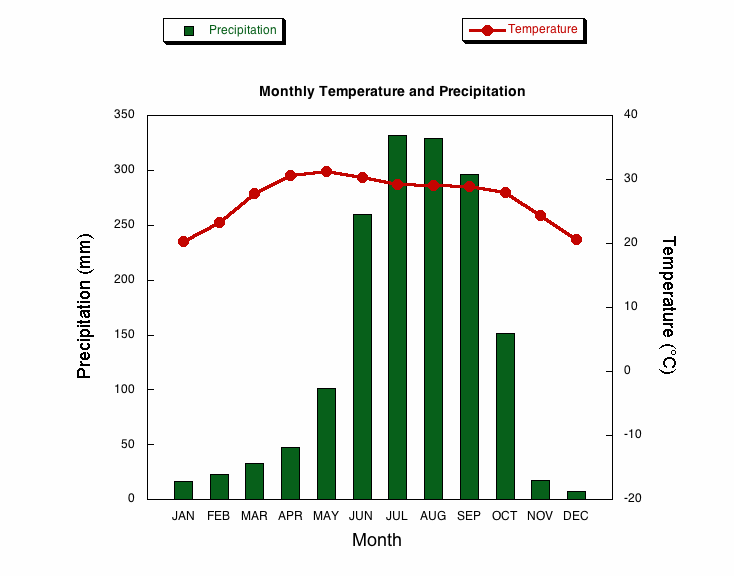
Climograph
http://drought.unl.edu/whatis/iclimographs/CalcuttaMetric.htm
A climograph is a graph depicting climate variables. The image above shows monthly precipitation and temperature in a particular region. Climate is a geographic variable, which makes this a map or geovisualization.
No comments:
Post a Comment
Newer Post
Older Post
Home
Subscribe to:
Post Comments (Atom)
No comments:
Post a Comment