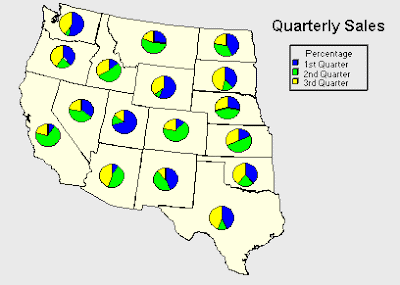
A pie chart map is one in which the variable of interest is displayed using a pie graph over a particular location. The map above shows the western half of the US and the quarterly sales for a company per state. In each pie graph, the percentage of sales is depicted by color.

No comments:
Post a Comment