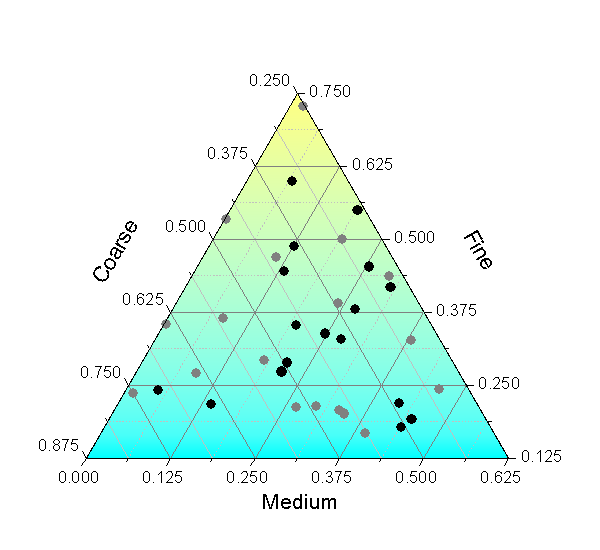
A triangular plot graphs a variable of interest according to three properties depicted on the three sides of the triangle. One very common triangle graph variable, which is shown in the image above, is soil composition and type. The points in the triangle represent sediments of interest mapped according to their thickness. This geographic feature makes this a form of geovisualization.
No comments:
Post a Comment